Intro to Google DevTools: Sources Panel
Intro to Google DevTools: Sources Panel
Today's article will give an overview of the Sources panel in Google DevTools. The Sources panel allows you to easily debug and see what is going on with your code. First we’re going to cover some basics on how to use breakpoints. They are very useful and we’ll use them by going through a function call.
Breakpoints
I’ll be using my old D&D site as an example here and navigate to the Grand Heroes page. After that we’ll need to navigate to the Sources panel in Google DevTools. Once there you should select the grandheroes.php file and see some code in the window. Here we will now cover how to add, remove and toggle breakpoints on and off.
Sources panel

Adding breakpoints is fairly straightforward. On the Sources panel in the grandheroes.php file, you should see lines with numbers on them. All you have to do is click on those to which you would like to add your breakpoints.
Adding a breakpoint
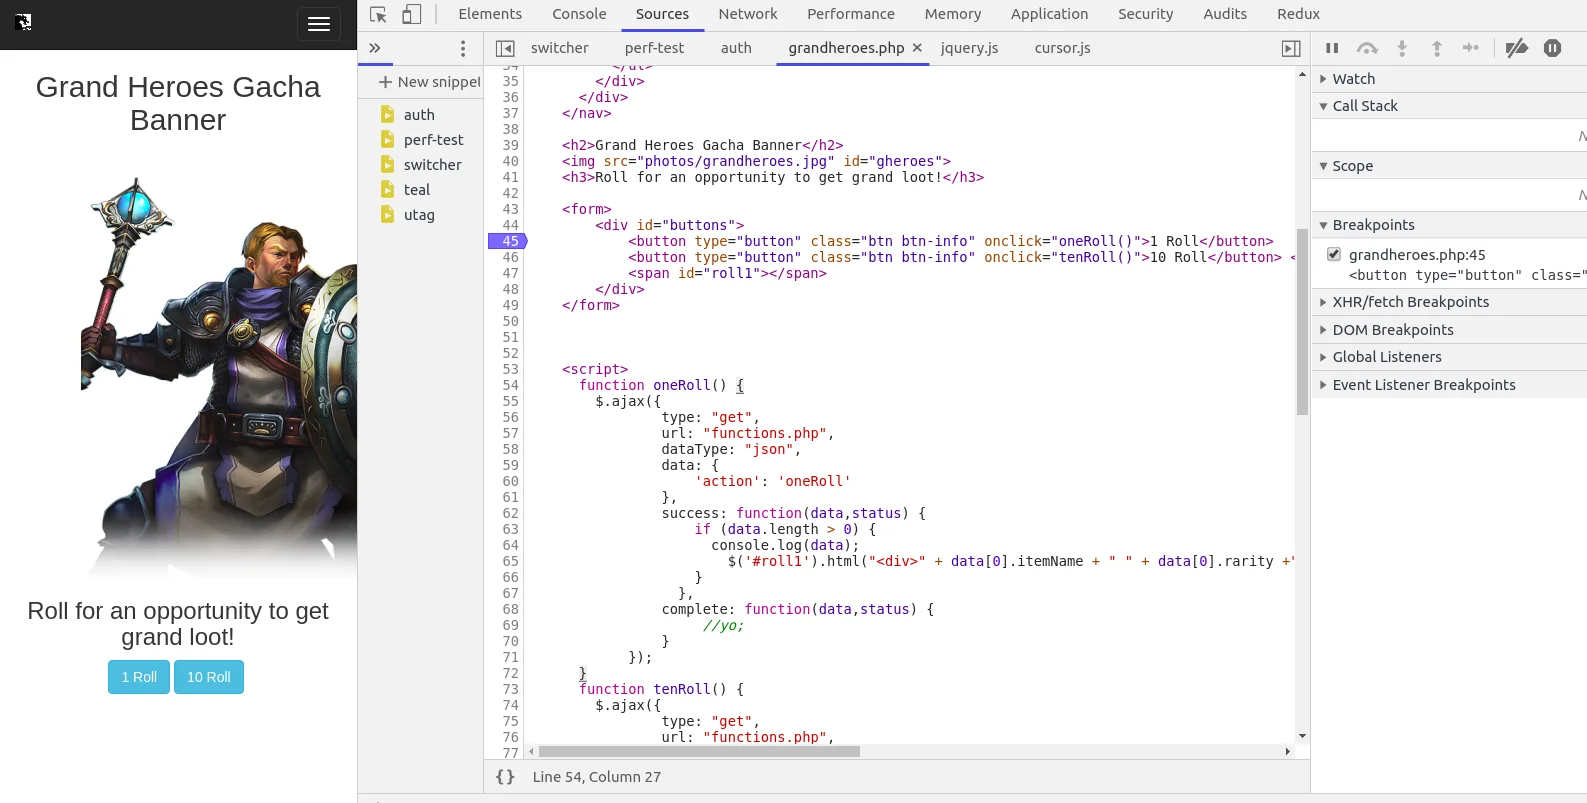
Removing breakpoints is just as easy. Looking at the same grandheroes.php file we should have some blue breakpoints (which now appear as red dots if you have the latest version of Chrome installed). All we have to do is now click on those blue breakpoints, and they will be removed. Another way of removing them is to go to the right side of the Sources panel, and open up the Breakpoints tab. From here, you can right click and select “Remove breakpoint” or “Remove all breakpoints”.
Removing a breakpoint

Removing a breakpoint with Breakpoint tab

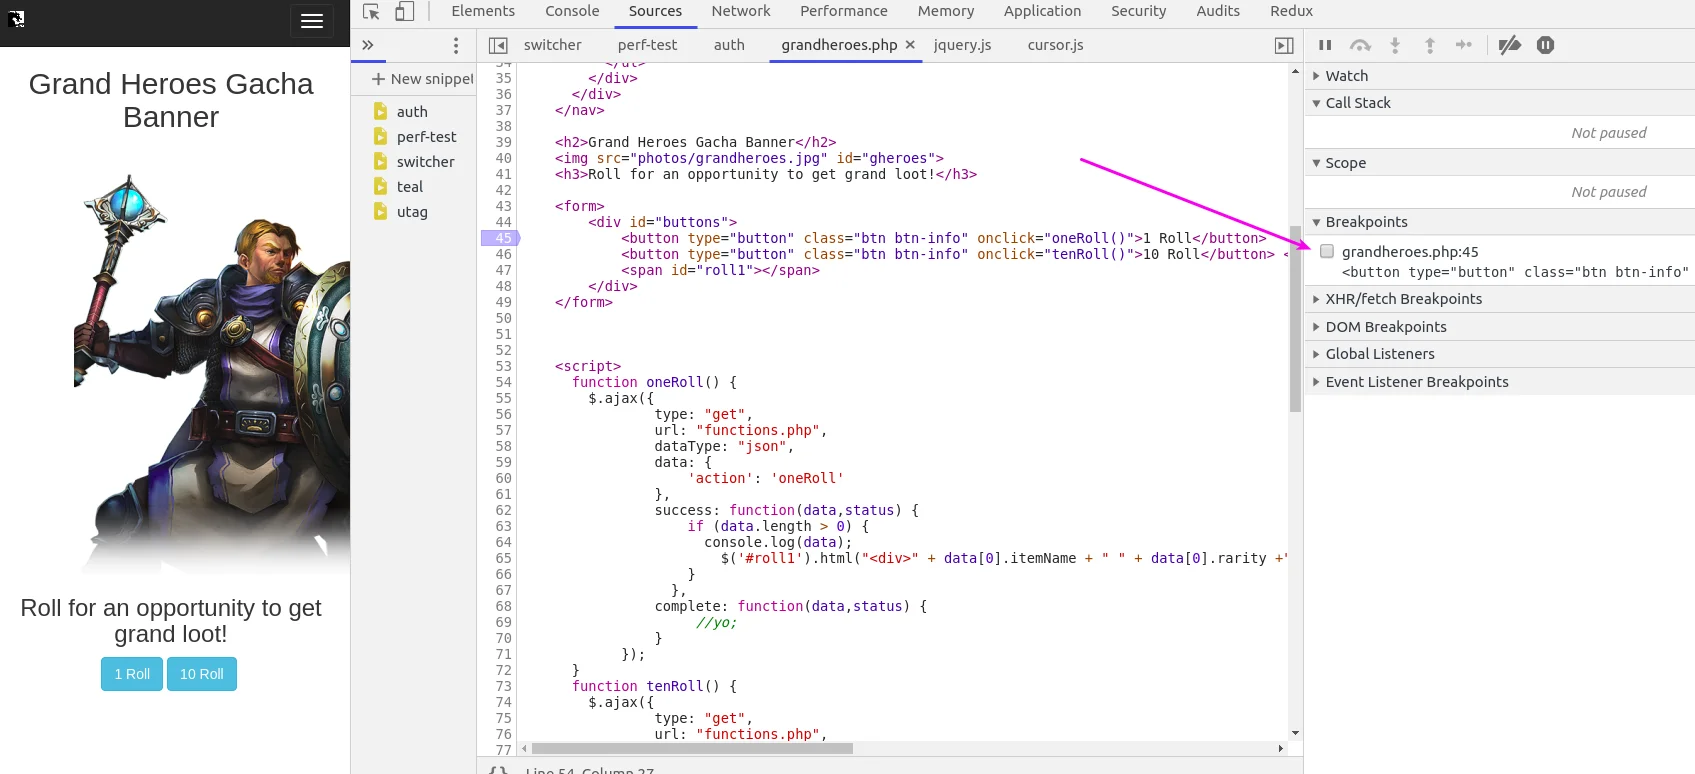
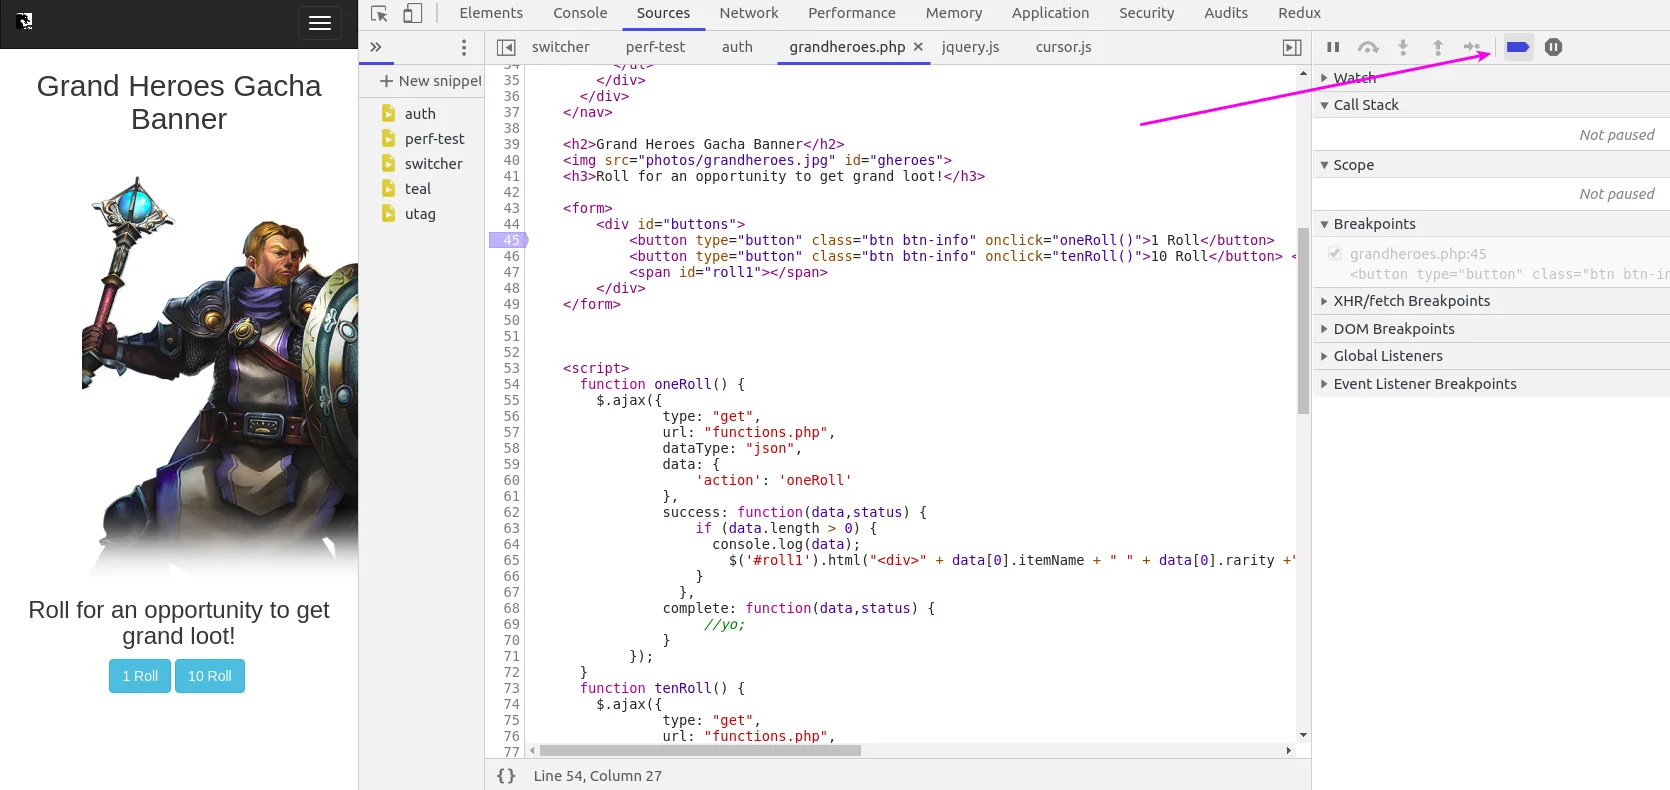
Toggling breakpoints on and off is pretty straightforward. After selecting breakpoints on the grandheroes.php page again, we can navigate over to the Breakpoints tab on the right. From here, we can click on the check boxes to enable or disable a breakpoint. We can also right click on the Breakpoints tab, and choose “Deactivate breakpoints” or “Disable all breakpoints”. Finally, above the Breakpoints tab at the very top, you should see an arrow pointing to the right with a diagonal line through it. By clicking this arrow, you can also toggle the breakpoints on and off.
Toggling a breakpoint from Breakpoints tab
Toggling a breakpoint with the arrow
Following a function call So now that we know how to set, remove, and toggle breakpoints, we will be using them to follow a function call. We’ll start by making sure we’re on the Grand Heroes page, and then we'll open up our Sources panel. After that, we’ll navigate to the gandheroes.php file in the Sources panel, and click on line 63 and 65.
Line 63 and 65
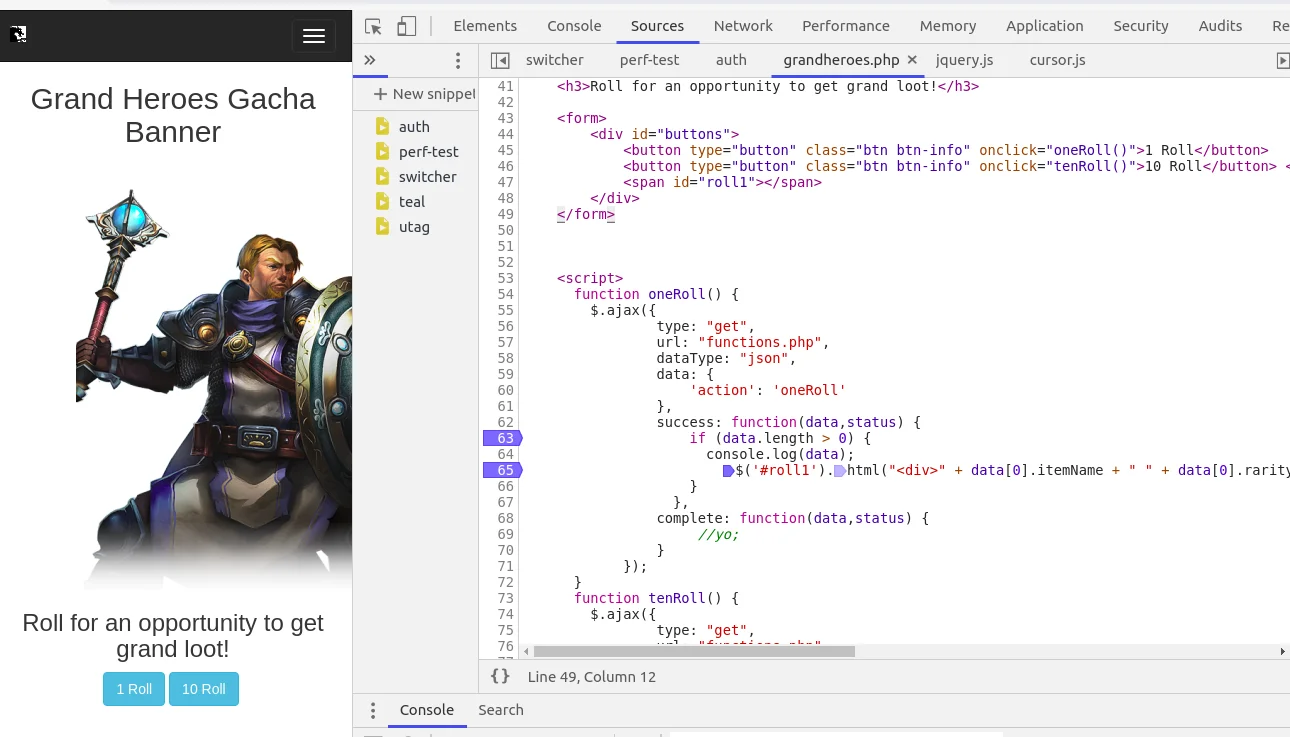
From here, we’ll click on the 1 Roll button, which will trigger our function call called oneRoll(). This should hit our first breakpoint on line 63, where we have an if case. We can now verify that the if case is true and the data does in fact have a length greater than 0.
Breakpoint 1
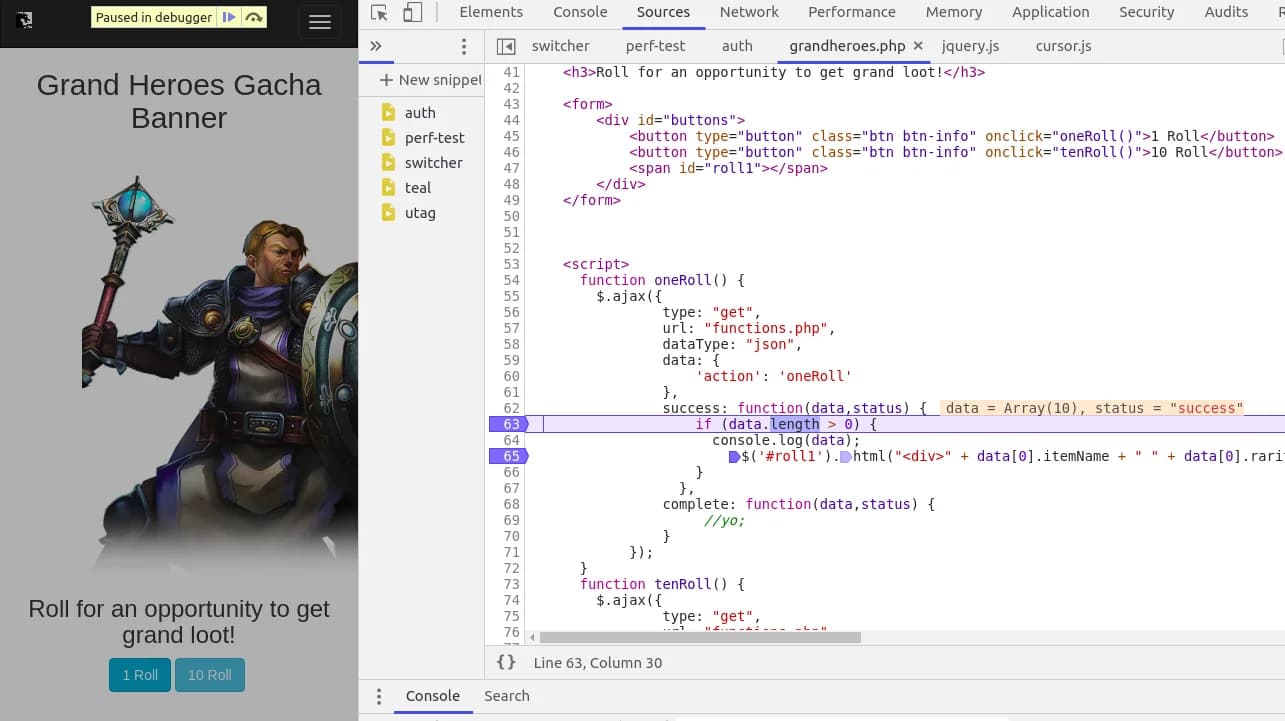
We’ll continue to the next breakpoint by resuming the script execution. You can do this by clicking F8 or the bar and right arrow symbol in the top right corner above the Watch tab. Here we can see that it enters the if case and will start to output the data.
Breakpoint 2
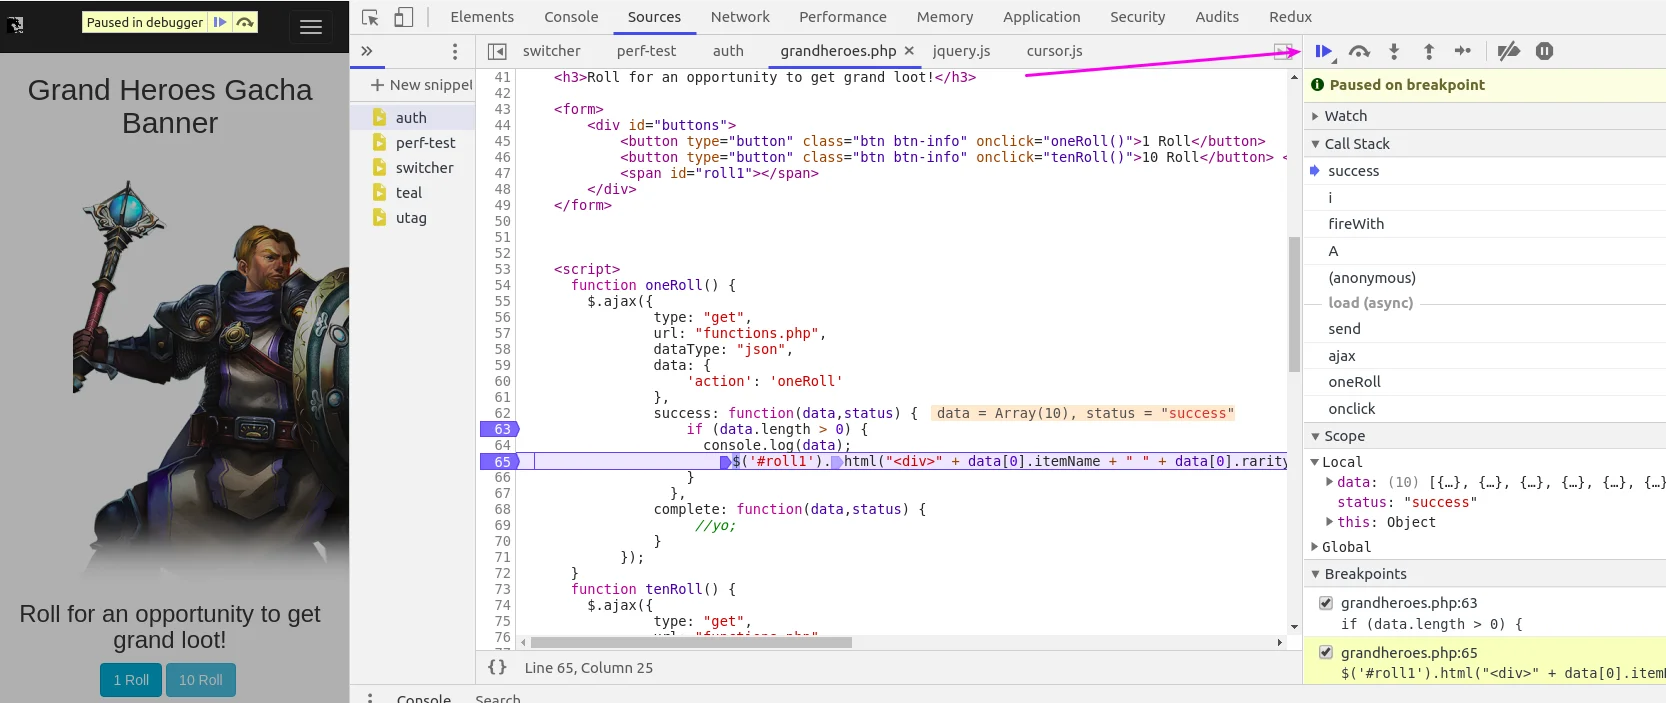
After seeing this, we’ll resume the script execution again, which will move us past our last breakpoint. We will see that the page has now updated with the information received from our function call.
Data loaded from function call
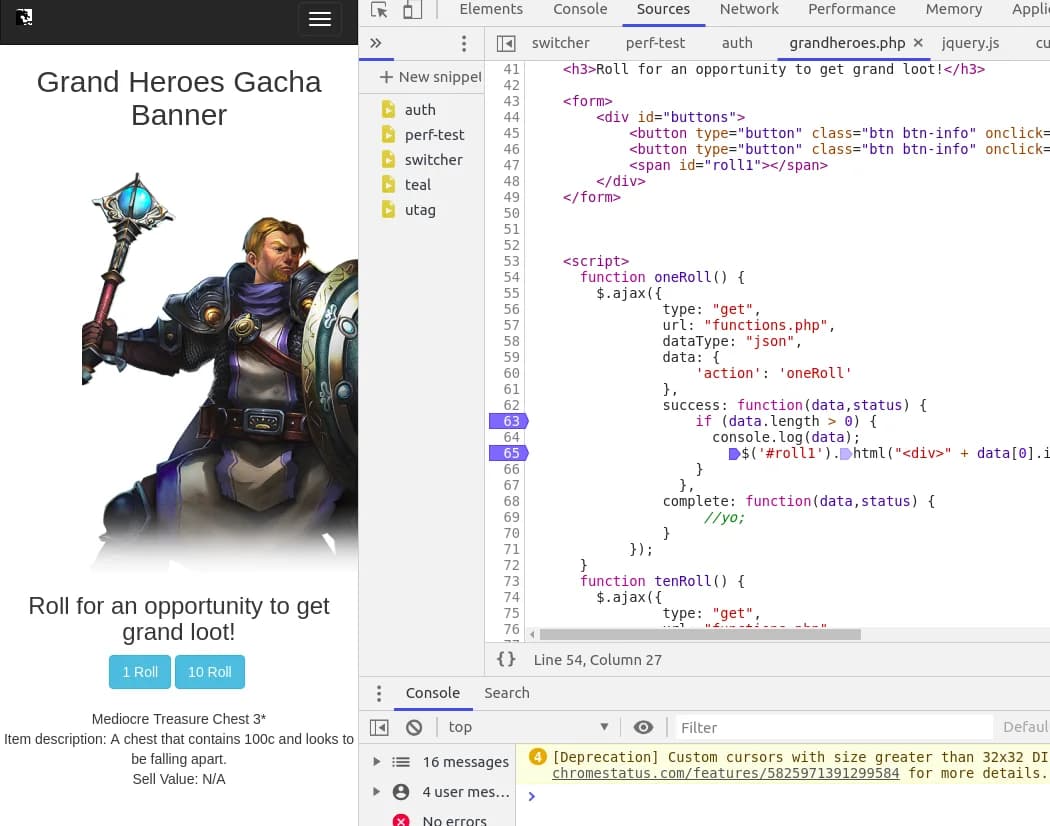
Conclusion
Today's article covered an overview of the Sources panel in Google DevTools. Hopefully, after reading this, you will have learned something new and useful. I personally find the Sources panel to be extremely helpful. I use it daily for work, and it always helps me get through my code problems.
I originally wrote this for This Dot Labs and the original post can be found here.